Stellar Spectra
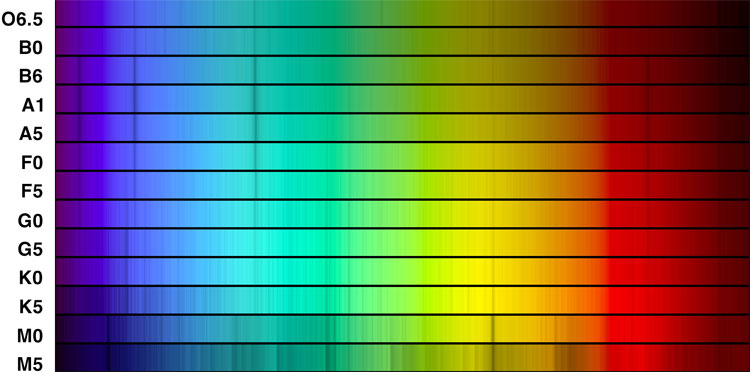
The spectral sequence from O through M.
Spectra of stars of various spectral types.
(Modified version of KPNO 0.9-m Telescope, AURA, NOAO, NSF)
The spectral sequence is defined by the absorption lines in the various spectra. The letters were devised as a way to abbreviate the kind of absorption lines observed. For instance, if a spectrum shows strong molecular absorption bands it is defined as type M (for molecules). If molecular absorption is weak or absent but there are strong absorption lines of ionized calcium in the blue-violet part of the spectrum, it is defined as type K (in a catalogue/map of the solar spectrum done in the early 1800's (see below), Fraunhofer labeled these absorptions H and K; H might be confused with hydrogen or helium, so K was used for the label). Some stars, such as the Sun, show a feature in the blue portion of the spectrum which Fraunhofer labeled as G, so they are called G-type stars.
In the late 1800's and very early 1900's physicists did not understand why different gases absorbed different wavelengths, so astronomers, applying the incorrect understanding of the time to stellar spectra, presumed that the different spectra represented different compositions. Hence, M-type stars would have lots of molecules in the atmosphere, while G and K-type stars would have lots of calcium. By the 1920's physicists correctly understood the nature of spectral absorptions, and Cecilia Payne-Gaposchkin was able to show, using this better understanding of the absorptions, that the different spectra do not represent different compositions, but different temperatures. At very low temperatures molecules can exist in small numbers in the atmospheres of the stars, so their absorption bands appear; but at higher temperatures the molecules are torn to pieces (photodissociated) by the radiation of the star, so their absorption bands do not appear. hence, M-type stars are relatively cool by stellar standards, with surface temperatures of just a few thousand degrees (3 to 4 thousand Kelvins, or 5 to 7 thousand Fahrenheit degrees), while stars with other spectra are hotter.
(Much more to follow, including additional diagrams and text, at which time the part of the page dealing with stellar spectra will be given its own page).
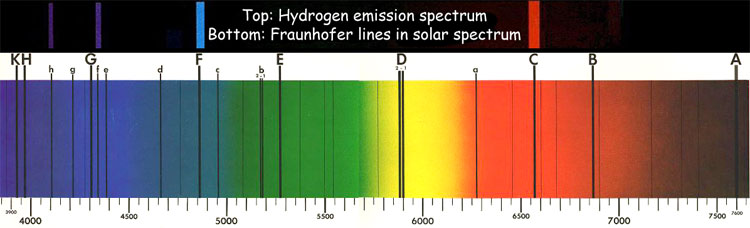 Fraunhofer's map of the Solar spectrum, showing the letters he assigned to various spectral features, and the correspondence of the C, F, f and h Fraunhofer lines to the visible-light hydrogen emission spectrum, indicating the presence of hydrogen atoms in the solar atmosphere.
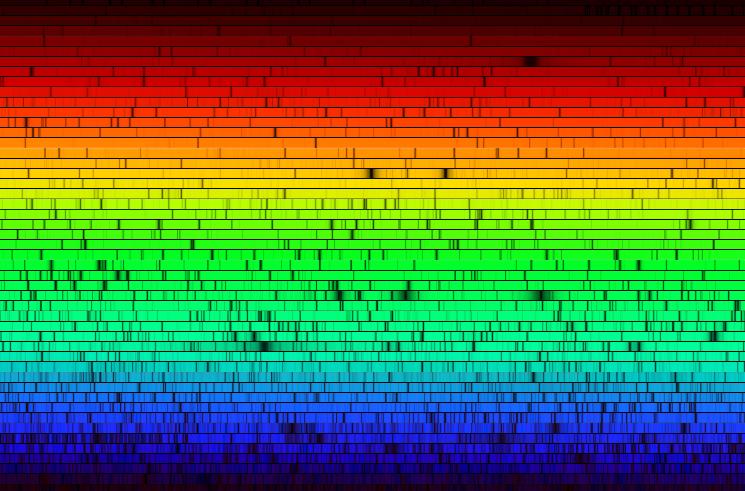
The Solar spectrum.
The colors are simulated, because film does respond to different colors in the same way as the eye.
(Nigel Sharp (NOAO), FTS, NSO, KPNO, AURA, NSF)
The Hertzsprung-Russell (HR) Diagram
 A Hertzsprung-Russell Diagram for nearby stars (in blue) looks very different from one for bright stars (in red). The Sun is more or less in the center of the Main Sequence, a diagonal line running from upper left (large bright hot stars) to lower right (small faint cool stars), which contains almost all nearby stars and a substantial fraction of bright ones. The vertical axis shows the brightness of the stars, measured by their absolute visual magnitude (calculated from their apparent magnitude and distance). The horizontal axis shows the color index of the stars (a measure of their temperatures), calculated by subtracting their V (visual) magnitudes from their B (blue) color magnitudes.

A Hertzsprung-Russell Diagram for the globular star cluster M55.Named after Ejnar Hertzsprung and Henry Norris Russell, the diagram plots stellar brightness against temperature. When done for a cluster of stars such as M55, this is called a "cluster diagram". The Main Sequence is clearly visible, as is the turnoff point (the upper end of the Main Sequence), which can be used to determine the age of the cluster (around 12 billion years). Comparing the Main Sequence for the cluster to the one for nearby stars yields the "distance modulus", a number which is related to the distance of the cluster. (B.J. Mochejska, J. Kaluzny (CAMK), 1m Swope Telescope, per APoD)
(Much more to follow, including additional diagrams and text, at which time the part of the page dealing with the Hertzsprung-Russell Diagram will be given its own page). |